
Earning Presentation
EARNINGS PRESENTATION THIRD QUARTER 2022 November 9, 2022
LEGAL DISCLAIMERS Forward-LookingInformation This presentation includes “forward-looking statements” within the meaning of the “safe harbor” provisions of the Private Securities Litigation Reform Act of 1995. Alta’s actual results may differ from their expectations, estimates and projections and consequently, you should not rely on these forward-looking statements as predictions of future events. Words such as “expect,” “estimate,” “project,” “budget,” “forecast,” “anticipate,” “intend,” “plan,” “may,” “will,” “could,” “should,” “believes,” “predicts,” “potential,” “continue,” and similar expressions are intended to identify such forward-looking statements. These forward-looking statements involve significant risks and uncertainties that could cause the actual results to differ materially from the expected results. Most of these factors are outside Alta’s control and are difficult to predict. Factors that may cause such differences include, but are not limited to: the impact of the COVID-19 outbreak or future epidemics on our business; federal, state, and local budget uncertainty, especially as it relates to infrastructure projects; the performance and financial viability of key suppliers, contractors, customers, and financing sources; economic, industry, business and political conditions including their effects on governmental policy and government actions that disrupt our supply chain or sales channels; our success in identifying acquisition targets and integrating acquisitions; our success in expanding into and doing business in additional markets; our ability to raise capital at favorable terms; the competitive environment for our products and services; our ability to continue to innovate and develop new business lines; our ability to attract and retain key personnel, including, but not limited to, skilled technicians; our ability to maintain our listing on The New York Stock Exchange; the impact of cyber or other security threats or other disruptions to our businesses; our ability to realize the anticipated benefits of acquisitions or divestitures, rental fleet investments or internal reorganizations; and other risks and uncertainties identified in this presentation or indicated from time to time in the section entitled “Risk Factors” in Alta’s annual report on Form 10-K and other filings with the U.S. Securities and Exchange Commission (the “SEC”). Alta cautions that the foregoing list of factors is not exclusive and readers should not place undue reliance upon any forward-looking statements, which speak only as of the date made. Alta does not undertake or accept any obligation or undertaking to release publicly any updates or revisions to any forward-looking statements to reflect any changein its expectations or any change in events, conditions or circumstances on which any such statement is based. Non-GAAP Financial Measures This presentation includes non-GAAP financial measures, including Adjusted EBITDA, Economic EBIT, organic revenue, and various free cash flow metrics. Alta believes that these non- GAAP measures are useful to investors for two principal reasons. First, Alta believes these measures may assist investors in comparing performance over various reporting periods on a consistent basis by removing from operating results the impact of items that do not reflect core operating performance. Second, these measures are used by Alta’s management to assess its performance and may (subject to the limitations described below) enable investors to compare the performance of Alta to its competition. Alta believes that the use of these non-GAAP financial measures provides an additional tool for investors to use in evaluating ongoing operating results and trends. These non-GAAP measures should not be considered in isolation from, or as an alternative to, financial measures determined in accordance with GAAP. Other companies may calculate Adjusted EBITDA, Economic EBIT, organic revenue, and free cash flow and other non-GAAP financial measures differently, and therefore Alta’s non-GAAP financial measures may not be directly comparable to similarly titled measures of other companies. With regard to our historical financial information, you can find the reconciliation of these non-GAAP financial measures to the most directly comparable GAAP measures in the Appendices at the end of this presentation. Alta is not providing a quantitative reconciliation of Non-GAAP Adjusted EBITDA guidance because certain financial information, the probable significance of which cannot be determined, is not available and cannot be reasonably estimated without unreasonable effort and expense. Specifically, Alta does not provide a reconciliation of forward-looking Non-GAAPAdjusted EBITDA to GAAP net income, due to the inherent difficulty in forecasting and quantifying certain items that are necessary for such reconciliation. Certain deductions for non-GAAP exclusions used to calculate projected GAAP net income may vary significantly based on actual events (including variations in acquired intangible asset amortization and stock compensation expense) and Alta is not able to forecast on a GAAP basis with reasonable certainty all deductions needed in order to provide a GAAP calculation of projected net income at this time. The amounts of these deductions may be material and, therefore, could result in projected GAAP net income being materially less than is indicated by projected Non-GAAP Adjusted EBITDA. Information in this presentation is not an offer to sell securities or the solicitation of an offer to buy securities, nor shall there be any sale of securities in any jurisdiction in which such offer, solicitation or sale would be unlawful prior to registration or qualification under the securities laws of such jurisdiction.
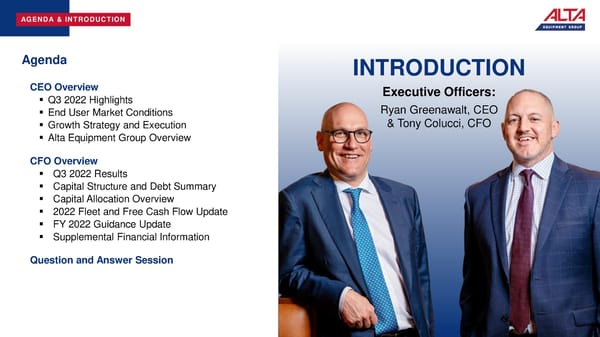
AGENDA & INTRODUCTION Agenda INTRODUCTION CEO Overview Executive Officers: ▪ Q3 2022 Highlights Ryan Greenawalt, CEO ▪ End User Market Conditions & Tony Colucci, CFO ▪ Growth Strategy and Execution ▪ Alta Equipment Group Overview CFO Overview ▪ Q3 2022 Results ▪ Capital Structure and Debt Summary ▪ Capital Allocation Overview ▪ 2022 Fleet and Free Cash Flow Update ▪ FY 2022 Guidance Update ▪ Supplemental Financial Information Question and Answer Session
CEO OVERVIEW Ryan Greenawalt
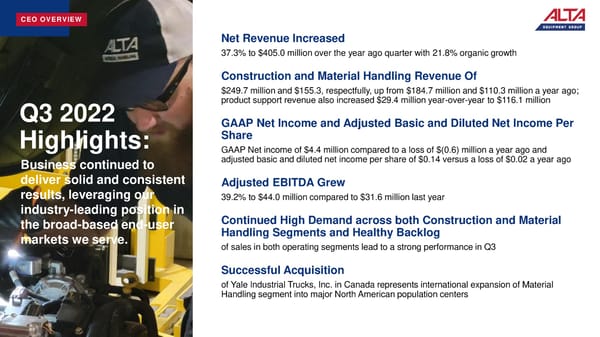
CEO OVERVIEW Net Revenue Increased 37.3% to $405.0 million over the year ago quarter with 21.8% organic growth Construction and Material Handling Revenue Of $249.7 million and $155.3, respectfully, up from $184.7 million and $110.3 million a year ago; Q3 2022 product support revenue also increased $29.4 million year-over-year to $116.1 million GAAP Net Income and Adjusted Basic and Diluted Net Income Per Highlights: Share GAAP Net income of $4.4 million compared to a loss of $(0.6) million a year ago and Business continued to adjusted basic and diluted net income per share of $0.14 versus a loss of $0.02 a year ago deliver solid and consistent Adjusted EBITDA Grew results, leveraging our 39.2% to $44.0 million compared to $31.6 million last year industry-leading position in Continued High Demand across both Construction and Material the broad-based end-user Handling Segments and Healthy Backlog markets we serve. of sales in both operating segments lead to a strong performance in Q3 Successful Acquisition of Yale Industrial Trucks, Inc. in Canada represents international expansion of Material Handling segment into major North American population centers
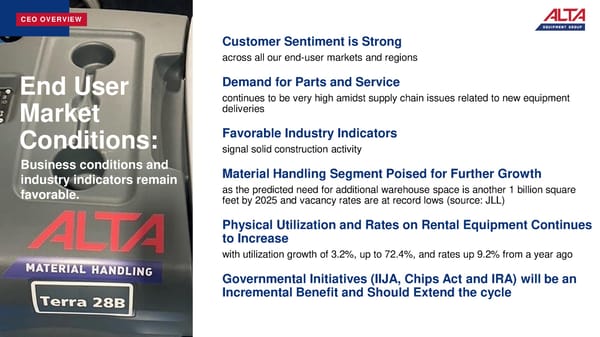
CEO OVERVIEW Customer Sentiment is Strong across all our end-user markets and regions End User Demand for Parts and Service continues to be very high amidst supply chain issues related to new equipment Market deliveries Conditions: Favorable Industry Indicators signal solid construction activity Business conditions and Material Handling Segment Poised for Further Growth industry indicators remain as the predicted need for additional warehouse space is another 1 billion square favorable. feet by 2025 and vacancy rates are at record lows (source: JLL) Physical Utilization and Rates on Rental Equipment Continues to Increase with utilization growth of 3.2%, up to 72.4%, and rates up 9.2% from a year ago Governmental Initiatives (IIJA, Chips Act and IRA) will be an Incremental Benefit and Should Extend the cycle
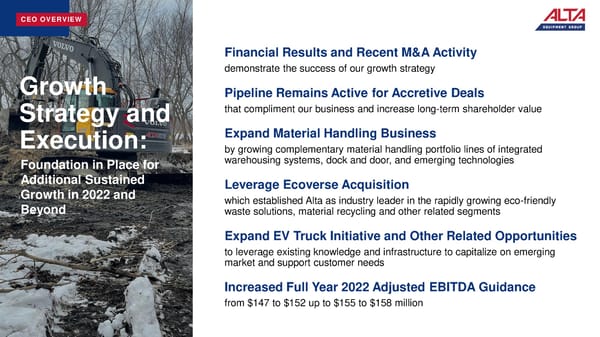
CEO OVERVIEW Financial Results and Recent M&A Activity Growth demonstrate the success of our growth strategy Pipeline Remains Active for Accretive Deals Strategy and that compliment our business and increase long-term shareholder value Execution: Expand Material Handling Business by growing complementary material handling portfolio lines of integrated Foundation in Place for warehousing systems, dock and door, and emerging technologies Additional Sustained Leverage Ecoverse Acquisition Growth in 2022 and which established Alta as industry leader in the rapidly growing eco-friendly Beyond waste solutions, material recycling and other related segments Expand EV Truck Initiative and Other Related Opportunities to leverage existing knowledge and infrastructure to capitalize on emerging market and support customer needs Increased Full Year 2022 Adjusted EBITDA Guidance from $147 to $152 up to $155 to $158 million
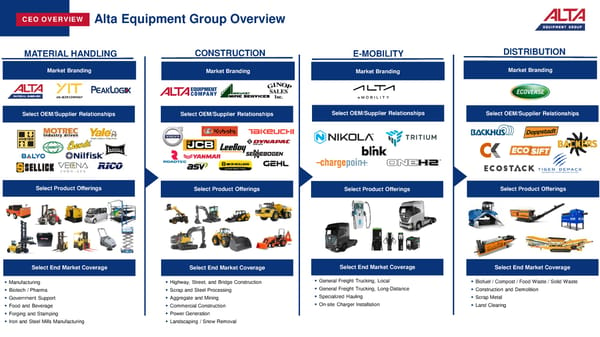
CEO OVERVIEW Alta Equipment Group Overview MATERIAL HANDLING CONSTRUCTION E-MOBILITY DISTRIBUTION Market Branding Market Branding Market Branding Market Branding Select OEM/Supplier Relationships Select OEM/Supplier Relationships Select OEM/Supplier Relationships Select OEM/Supplier Relationships Select Product Offerings Select Product Offerings Select Product Offerings Select Product Offerings Select End Market Coverage Select End Market Coverage Select End Market Coverage Select End Market Coverage ▪ Manufacturing ▪ Highway, Street, and Bridge Construction ▪ General Freight Trucking, Local ▪ Biofuel / Compost / Food Waste / Solid Waste ▪ Biotech / Pharma ▪ Scrap and Steel Processing ▪ General Freight Trucking, Long-Distance ▪ Construction and Demolition ▪ Government Support ▪ Aggregate and Mining ▪ Specialized Hauling ▪ Scrap Metal ▪ Food and Beverage ▪ Commercial Construction ▪ On-site Charger Installation ▪ Land Clearing ▪ Forging and Stamping ▪ Power Generation ▪ Iron and Steel Mills Manufacturing ▪ Landscaping / Snow Removal
CFO OVERVIEW Tony Colucci
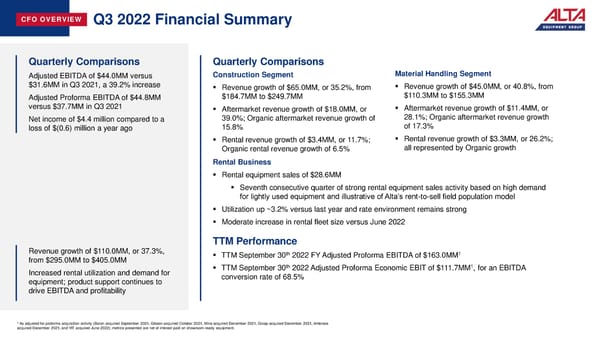
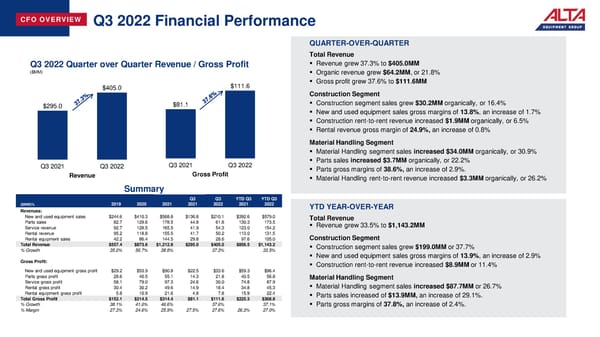
CFO OVERVIEW Q3 2022 Financial Summary Quarterly Comparisons Quarterly Comparisons Adjusted EBITDA of $44.0MM versus Construction Segment Material Handling Segment $31.6MM in Q3 2021, a 39.2% increase ▪ Revenue growth of $65.0MM, or 35.2%, from ▪ Revenue growth of $45.0MM, or 40.8%, from Adjusted Proforma EBITDA of $44.8MM $184.7MM to $249.7MM $110.3MM to $155.3MM versus $37.7MM in Q3 2021 ▪ Aftermarket revenue growth of $18.0MM, or ▪ Aftermarket revenue growth of $11.4MM, or Net income of $4.4 million compared to a 39.0%; Organic aftermarket revenue growth of 28.1%; Organic aftermarket revenue growth loss of $(0.6) million a year ago 15.8% of 17.3% ▪ Rental revenue growth of $3.4MM, or 11.7%; ▪ Rental revenue growth of $3.3MM, or 26.2%; Organic rental revenue growth of 6.5% all represented by Organic growth Rental Business ▪ Rental equipment sales of $28.6MM ▪ Seventh consecutive quarter of strong rental equipment sales activity based on high demand for lightly used equipment and illustrative of Alta’s rent-to-sell field population model ▪ Utilization up ~3.2% versus last year and rate environment remains strong ▪ Moderate increase in rental fleet size versus June 2022 TTM Performance Revenue growth of $110.0MM, or 37.3%, th 1 from $295.0MM to $405.0MM ▪ TTM September 30 2022 FY Adjusted Proforma EBITDA of $163.0MM th 1 Increased rental utilization and demand for ▪ TTM September 30 2022 Adjusted Proforma Economic EBIT of $111.7MM , for an EBITDA equipment; product support continues to conversion rate of 68.5% drive EBITDA and profitability 1 As adjusted for proforma acquisition activity (Baron acquired September 2021, Gibson acquired October 2021, Mine acquired December 2021, Ginop acquired December 2021, Ambrose acquired December 2021, and YIT acquired June 2022); metrics presented are net of interest paid on showroom-ready equipment.
This is a modal window.
CFO OVERVIEW Q3 2022 Financial Performance QUARTER-OVER-QUARTER Total Revenue Q3 2022 Quarter over Quarter Revenue / Gross Profit ▪ Revenue grew 37.3% to $405.0MM ($MM) ▪ Organic revenue grew $64.2MM, or 21.8% $405.0 $111.6 ▪ Gross profit grew 37.6% to $111.6MM Construction Segment $295.0 $81.1 ▪ Construction segment sales grew $30.2MM organically, or 16.4% ▪ New and used equipment sales gross margins of 13.8%, an increase of 1.7% ▪ Construction rent-to-rent revenue increased $1.9MM organically, or 6.5% ▪ Rental revenue gross margin of 24.9%, an increase of 0.8% Material Handling Segment ▪ Material Handling segment sales increased $34.0MM organically, or 30.9% Q3 2021 Q3 2022 Q3 2021 Q3 2022 ▪ Parts sales increased $3.7MM organically, or 22.2% Revenue Gross Profit ▪ Parts gross margins of 38.6%, an increase of 2.9%. ▪ Material Handling rent-to-rent revenue increased $3.3MM organically, or 26.2% Summary Q3 Q3 YTD Q3 YTD Q3 ($MM)% 2019 2020 2021 2021 2022 2021 2022 YTD YEAR-OVER-YEAR Revenues: New and used equipment sales $244.6 $410.3 $568.8 $136.8 $210.1 $392.6 $579.0 Total Revenue Parts sales 82.7 129.6 178.5 44.8 61.8 130.3 173.5 ▪ Revenue grew 33.5% to $1,143.2MM Service revenue 92.7 128.5 165.5 41.9 54.3 123.0 154.2 Rental revenue 95.2 118.8 155.5 41.7 50.2 113.0 131.5 Construction Segment Rental equipment sales 42.2 86.4 144.5 29.8 28.6 97.6 105.0 Total Revenue $557.4 $873.6 $1,212.8 $295.0 $405.0 $856.5 $1,143.2 ▪ Construction segment sales grew $199.0MM or 37.7% % Growth 35.0% 56.7% 38.8% 37.3% 33.5% ▪ New and used equipment sales gross margins of 13.9%, an increase of 2.9% Gross Profit: ▪ Construction rent-to-rent revenue increased $8.9MM or 11.4% New and used equipment gross profit $29.2 $53.9 $90.8 $22.5 $33.6 $59.3 $96.4 Parts gross profit 28.6 40.5 55.1 14.3 21.8 40.5 56.8 Material Handling Segment Service gross profit 58.1 79.0 97.3 24.6 30.0 74.8 87.9 ▪ Material Handling segment sales increased $87.7MM or 26.7% Rental gross profit 30.4 30.2 49.6 14.9 18.4 34.8 45.3 Rental equipment gross profit 5.8 10.9 21.6 4.8 7.8 15.9 22.4 ▪ Parts sales increased of $13.9MM, an increase of 29.1%. Total Gross Profit $152.1 $214.5 $314.4 $81.1 $111.6 $225.3 $308.8 % Growth 38.1% 41.0% 46.6% 37.6% 37.1% ▪ Parts gross margins of 37.8%, an increase of 2.4%. % Margin 27.3% 24.6% 25.9% 27.5% 27.6% 26.3% 27.0%
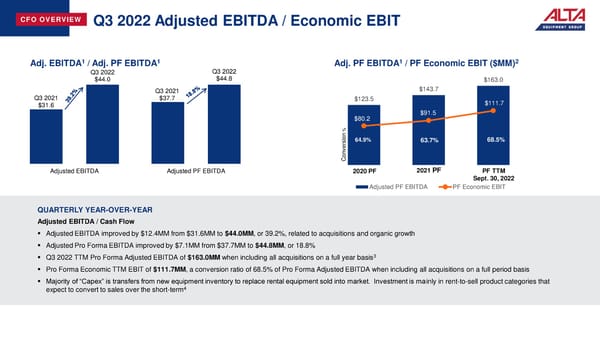
CFO OVERVIEW Q3 2022 Adjusted EBITDA / Economic EBIT 1 1 1 2 Adj. EBITDA / Adj. PF EBITDA Adj. PF EBITDA / PF Economic EBIT ($MM) Q3 2022 Q3 2022 $44.0 $44.8 $163.0 Q3 2021 $143.7 Q3 2021 $37.7 $123.5 $111.7 $31.6 $80.2 $91.5 % ion64.9% 63.7% 68.5% ers onv C Adjusted EBITDA Adjusted PF EBITDA 2020 PF 2021PF PF TTM Sept. 30, 2022 Adjusted PF EBITDA PF Economic EBIT QUARTERLY YEAR-OVER-YEAR Adjusted EBITDA / Cash Flow ▪ Adjusted EBITDA improved by $12.4MM from $31.6MM to $44.0MM, or 39.2%, related to acquisitions and organic growth ▪ Adjusted Pro Forma EBITDA improved by $7.1MM from $37.7MM to $44.8MM, or 18.8% ▪ Q3 2022 TTM Pro Forma Adjusted EBITDA of $163.0MM when including all acquisitions on a full year basis3 ▪ Pro Forma Economic TTM EBIT of $111.7MM, a conversion ratio of 68.5% of Pro Forma Adjusted EBITDA when including all acquisitions on a full period basis ▪ Majority of “Capex” is transfers from new equipment inventory to replace rental equipment sold into market. Investment is mainly in rent-to-sell product categories that expect to convert to sales over the short-term4
CFO OVERVIEW Alta Equipment Group - Proforma Financial Profile 2020 2021 YTD Q3 2021 YTD Q3 2022 TTM ($MM) 2020 2021 PF + Acq1 PF + Acq1 PF + Acq1 PF + Acq1 Sept. 30, 2022 Alta Revenue $873.6 $1,212.8 $873.6 $1,212.8 $856.5 $1,143.2 $1,499.5 Acquisitions Revenue - - 352.0 182.0 140.8 27.2 68.4 Total Revenue $873.6 $1,212.8 $1,225.6 $1,394.8 $997.3 $1,170.4 $1,567.9 % Growth 38.8% 1.1% 13.8% 17.4% Alta Gross Profit $214.5 $314.4 $214.5 $314.4 $225.3 $308.8 $397.9 Acquisition Gross Profit - - 87.4 44.7 34.7 6.6 16.6 Total Gross Profit $214.5 $314.4 $301.9 $359.1 $260.0 $315.4 $414.5 % margin 24.6% 25.9% 24.6% 25.7% 26.1% 26.9% 26.4% Alta Operating Expenses2 222.6 296.4 222.6 296.4 215.6 277.5 358.3 Acquisitions Operating Expenses - - 68.2 31.9 24.9 5.9 12.9 Operating Expenses2 $222.6 $296.4 $290.8 $328.3 $240.5 $283.4 $371.2 Alta Adjusted EBITDA 83.0 120.0 83.0 120.0 83.1 115.4 152.3 Acquisitions Adjusted EBITDA - - 40.5 23.7 18.6 5.6 10.7 Total Adjusted PF EBITDA [1] $83.0 $120.0 $123.5 $143.7 $101.7 $121.0 $163.0 % Margin 9.5% 9.9% 10.1% 10.3% 10.2% 10.3% 10.4% Alta Gross Profit on Rental Equipment Sales (10.9) (21.6) (10.9) (21.6) (15.9) (22.4) (28.1) Acquisitions Gross Profit on Rental Equipment Sales - - (4.0) (2.3) (1.8) (0.5) (1.0) Rental Net Maintenance Capex (9.1) (16.0) (9.1) (16.0) (8.8) (3.9) (11.1) 3 Non-Rental PP&E Maintenance Capex (3.0) (3.8) (3.0) (3.8) (3.6) (6.2) (6.4) Acquisitions Rental Net Maintenance Capex - - (13.4) (6.4) (4.8) (2.2) (3.8) Acquisitions Non-Rental PP&E Maintenance Capex - - (2.9) (2.1) (1.7) (0.5) (0.9) PF Economic EBIT [1] $60.0 $78.6 $80.2 $91.5 $65.1 $85.3 $111.7 Cash Interest Expense, non-floorplan interest (21.5) (22.3) (16.5) (19.8) (25.6) Working Capital Investment (3.9) (27.7) (22.9) (45.9) (50.7) Preferred Dividend - (2.6) (1.8) (2.2) (3.0) Advance on Net Maintenance Capex and Working Capital4 16.1 30.7 22.0 26.8 35.6 Levered FCF to Common Equity, before Growth Capex [1] $70.9 $69.6 $45.6 $44.9 $69.0
CFO OVERVIEW Capital Structure / Credit Profile Balance Sheet Strength / Liquidity5 Capital Structure ($MM) EV/Adj. PF 700,000 $642MM Approx. $268MM September 30, 2022 $ Amount EBITDA 600,000 Availability at Q3 Cash $2.1 1 500,000 $427MM Debt: 400,000 Lines of Credit (ABL)2 $158.4 300,000 2.7x Floor Plan – Used and Rental 50.1 200,000 Coverage $158MM Finance Lease Liabilities 17.0 1.4x 100,000 3 2nd Lien Note 315.0 1.9x - Total Debt $540.5 Book Value Borrowing Base Senior Debt Accounts Receivable Parts Inventory Fleet Inventory (New/Used/Rental) Net Debt: Total Debt minus Cash $538.4 3.3x 4 Market Capitalization $380.5 5.6x *Excludes Equipment on Floorplan, WIP, PP&E, and long-term receivables CREDIT FACILITY LEVERAGE RATIO ▪ Liquidity of ~$269.7MM as of September 30, 2022 Q1 2021 Q2 2022 Q3 2022 2022F ▪ Availability of ~$267.6MM as of September 30, 2022 Total Net Debt / Adj. PF 3.5x 3.5x 3.3x 3.5x EBITDA ▪ Collateral Value Increased ~$22.0MM vs. Q2 2022, primarily related to YIT deal ▪ ABL Draw increased ~$28.0MM vs. Q2 2022, primarily related to YIT deal Leverage Improvement Q2 2022 to Q3 2022: ▪ $158.4MM outstanding balance under $430MM ABL facility as of September ▪ Increase in TTM EBITDA 30, 2022; ~$5.7MM of reserves and letters of credit ▪ 2022F ratio based on midpoint of FY22 EBITDA guidance and current leverage profile including Ecoverse, but excluding additional M&A ▪ Added capacity of $80.0 million via amended credit facility (July 2022)6
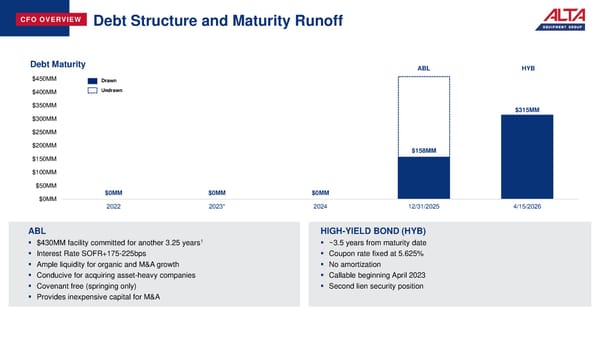
CFO OVERVIEW Debt Structure and Maturity Runoff Debt Maturity ABL HYB $450MM Drawn $400MM Undrawn $350MM $315MM $300MM $250MM $200MM $158MM $150MM $100MM $50MM $0MM $0MM $0MM $0MM 2022 2023* 2024 12/31/2025 4/15/2026 ABL HIGH-YIELD BOND (HYB) ▪ $430MM facility committed for another 3.25 years1 ▪ ~3.5 years from maturity date ▪ Interest Rate SOFR+175-225bps ▪ Coupon rate fixed at 5.625% ▪ Ample liquidity for organic and M&A growth ▪ No amortization ▪ Conducive for acquiring asset-heavy companies ▪ Callable beginning April 2023 ▪ Covenant free (springing only) ▪ Second lien security position ▪ Provides inexpensive capital for M&A
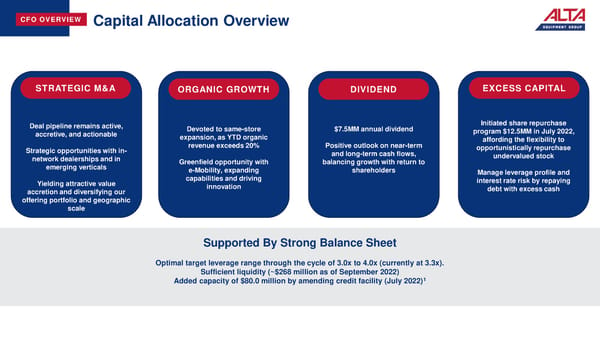
CFO OVERVIEW Capital Allocation Overview Excess Capital STRATEGIC M&A ORGANIC GROWTH DIVIDEND EXCESS CAPITAL Deal pipeline remains active, Devoted to same-store $7.5MM annual dividend Initiated share repurchase accretive, and actionable expansion, as YTD organic program $12.5MM in July 2022, revenue exceeds 20% Positive outlook on near-term affording the flexibility to Strategic opportunities with in- and long-term cash flows, opportunistically repurchase network dealerships and in Greenfield opportunity with balancing growth with return to undervalued stock emerging verticals e-Mobility, expanding shareholders Manage leverage profile and Yielding attractive value capabilities and driving interest rate risk by repaying accretion and diversifying our innovation debt with excess cash offering portfolio and geographic scale Supported By Strong Balance Sheet Optimal target leverage range through the cycle of 3.0x to 4.0x (currently at 3.3x). Sufficient liquidity (~$268 million as of September 2022) Added capacity of $80.0 million by amending credit facility (July 2022)1
CFO OVERVIEW Rental Fleet and Free Cash Flow from Operations Rental Cap-Ex Summary ($MM)1 +3% YOY +9% YOY Nine Nine Physical Improvement Months Months 5 in rental utilization 5 Ended Sept. Ended Sept. rates 2020 2021 30, 2021 30, 2022 Gross Rental Capex $159.4 $207.6 $164.1 $140.9 OEC of Rental Fleet Sold (95.5) (160.5) (106.4) (108.9) Net Rental Capex Invested $63.9 $47.1 $57.7 $32.0 +$143MM Highlight of the 2022 Fleet Investment Rent-to-Sell Field proceeds as since 2020 to Population Model % of OEC: refresh and 96% grow rental Cash Flow Summary ($MM)2 fleet Nine Months Nine Months Ended Ended 2020 2021 Sept. 30, 2021 Sept. 30, 2022 3 $60.0 $78.6 $54.8 $82.9 Economic EBIT 4 Free Cash Flow from Operations (7.1) 31.6 30.6 23.5
CFO OVERVIEW Q3 2022 – Increasing FY 2022 Guidance FY 2022 OUTLOOK ($ IN MM) ADJUSTED EBITDA: FY 2022 From: GUIDANCE $147.0-$152.0 To: $155.0-$158.0 (Net of New Equipment Floorplan Interest) 2022 GUIDANCE COMMENTARY: HIGHLIGHTS/RATIONALE ▪ Outperforming expectations from the end of 2021 in all business lines ▪ End-market demand and pricing environment continues to be favorable ▪ New equipment deliveries from OEMs volatile but stabilizing ▪ Ecoverse Acquisition will provide incremental EBITDA for remainder of year ▪ Outlook does not include any further M&A activities beyond Ecoverse ▪ Seasonality in northern construction markets temper Q4 expectations relative to Q3
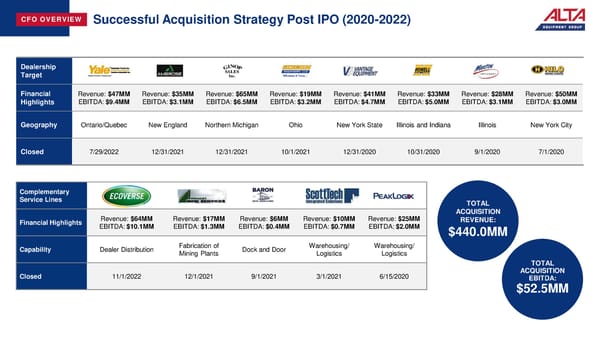
CFO OVERVIEW Successful Acquisition Strategy Post IPO (2020-2022) Dealership Target Financial Revenue: $47MM Revenue: $35MM Revenue: $65MM Revenue: $19MM Revenue: $41MM Revenue: $33MM Revenue: $28MM Revenue: $50MM Highlights EBITDA: $9.4MM EBITDA: $3.1MM EBITDA: $6.5MM EBITDA: $3.2MM EBITDA: $4.7MM EBITDA: $5.0MM EBITDA: $3.1MM EBITDA: $3.0MM Geography Ontario/Quebec New England Northern Michigan Ohio New York State Illinois and Indiana Illinois New York City Closed 7/29/2022 12/31/2021 12/31/2021 10/1/2021 12/31/2020 10/31/2020 9/1/2020 7/1/2020 Complementary Service Lines TOTAL ACQUISITION Financial Highlights Revenue: $64MM Revenue: $17MM Revenue: $6MM Revenue: $10MM Revenue: $25MM REVENUE: EBITDA: $10.1MM EBITDA: $1.3MM EBITDA: $0.4MM EBITDA: $0.7MM EBITDA: $2.0MM $440.0MM Capability Dealer Distribution Fabrication of Dock and Door Warehousing/ Warehousing/ Mining Plants Logistics Logistics TOTAL Closed 11/1/2022 12/1/2021 9/1/2021 3/1/2021 6/15/2020 ACQUISITION EBITDA: $52.5MM
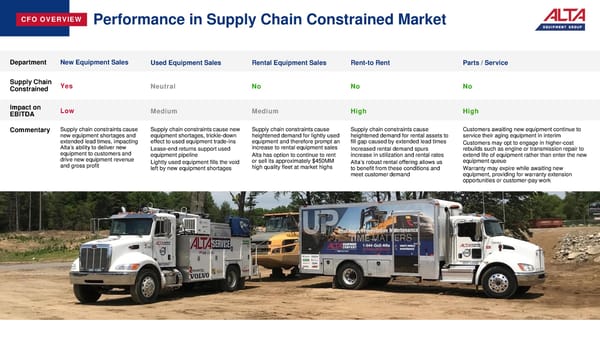
CFO OVERVIEW Performance in Supply Chain Constrained Market Department New Equipment Sales Used Equipment Sales Rental Equipment Sales Rent-to Rent Parts / Service Supply Chain Yes Neutral No No No Constrained Impact on Low Medium Medium High High EBITDA Commentary Supply chain constraints cause Supply chain constraints cause new Supply chain constraints cause Supply chain constraints cause Customers awaiting new equipment continue to new equipment shortages and equipment shortages, trickle-down heightened demand for lightly used heightened demand for rental assets to service their aging equipment in interim extended lead times, impacting effect to used equipment trade-ins equipment and therefore prompt an fill gap caused by extended lead times Customers may opt to engage in higher-cost Alta’s ability to deliver new Lease-end returns support used increase to rental equipment sales Increased rental demand spurs rebuilds such as engine or transmission repair to equipment to customers and equipment pipeline Alta has option to continue to rent increase in utilization and rental rates extend life of equipment rather than enter the new drive new equipment revenue Lightly used equipment fills the void or sell its approximately $450MM Alta’s robust rental offering allows us equipment queue and gross profit left by new equipment shortages high quality fleet at market highs to benefit from these conditions and Warranty may expire while awaiting new meet customer demand equipment, providing for warranty extension opportunities or customer-pay work
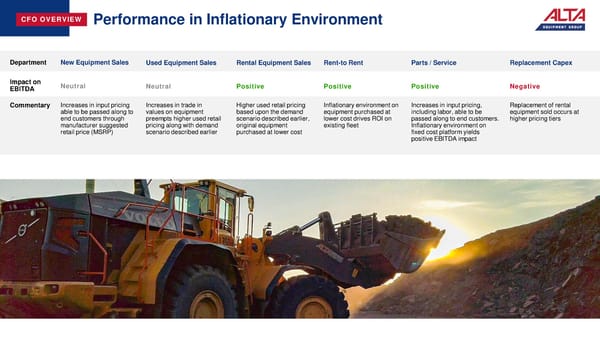
CFO OVERVIEW Performance in Inflationary Environment Department New Equipment Sales Used Equipment Sales Rental Equipment Sales Rent-to Rent Parts / Service Replacement Capex Impact on Neutral Neutral Positive Positive Positive Negative EBITDA Commentary Increases in input pricing Increases in trade in Higher used retail pricing Inflationary environment on Increases in input pricing, Replacement of rental able to be passed along to values on equipment based upon the demand equipment purchased at including labor, able to be equipment sold occurs at end customers through preempts higher used retail scenario described earlier, lower cost drives ROI on passed along to end customers. higher pricing tiers manufacturer suggested pricing along with demand original equipment existing fleet Inflationary environment on retail price (MSRP) scenario described earlier purchased at lower cost fixed cost platform yields positive EBITDA impact
THANK YOU (NYSE:ALTG) Investor Relations Contact: Kevin Inda SCR Partners M: (225) 772-0254 E: Kevin@scr-ir.com
APPENDICES About the Company Earnings Presentation | Third Quarter 2022 | November 9, 2022 23

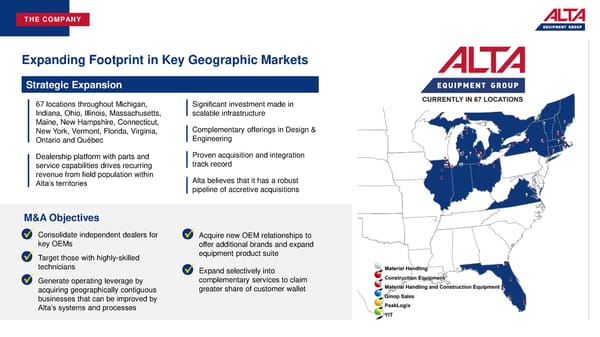
THE COMPANY Expanding Footprint in Key Geographic Markets Strategic Expansion 67 locations throughout Michigan, Significant investment made in Indiana, Ohio, Illinois, Massachusetts, scalable infrastructure Maine, New Hampshire, Connecticut, Complementary offerings in Design & New York, Vermont, Florida, Virginia, Engineering Ontario and Québec Dealership platform with parts and Proven acquisition and integration service capabilities drives recurring track record revenue from field population within Alta believes that it has a robust Alta’s territories pipeline of accretive acquisitions M&A Objectives Consolidate independent dealers for Acquire new OEM relationships to ✓key OEMs ✓offer additional brands and expand Target those with highly-skilled equipment product suite ✓technicians Expand selectively into ✓complementary services to claim Generate operating leverage by ✓acquiring geographically contiguous greater share of customer wallet businesses that can be improved by Alta’s systems and processes
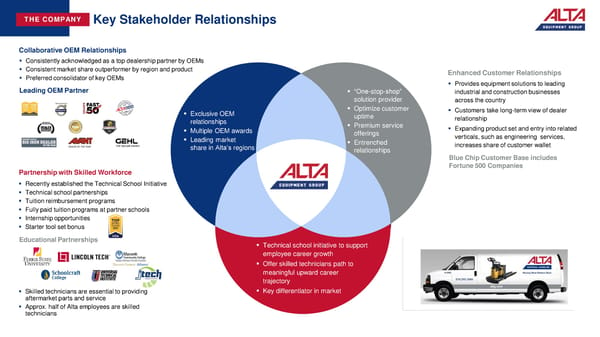
THE COMPANY Key Stakeholder Relationships CollaborativeOEM Relationships ▪ Consistently acknowledged as a top dealership partner by OEMs ▪ Consistent market share outperformer by region and product Enhanced CustomerRelationships ▪ Preferred consolidator of key OEMs ▪ Provides equipment solutions to leading Leading OEM Partner ▪ “One-stop-shop” industrial and construction businesses solution provider across the country ▪ Exclusive OEM ▪ Optimize customer ▪ Customers take long-term view of dealer relationships uptime relationship ▪ Multiple OEM awards ▪ Premium service ▪ Expanding product set and entry into related ▪ Leading market offerings verticals, such as engineering services, share in Alta’s regions ▪ Entrenched increases share of customer wallet relationships Blue Chip Customer Base includes Partnership with Skilled Workforce Fortune 500 Companies ▪ Recently established the Technical School Initiative ▪ Technical school partnerships ▪ Tuition reimbursement programs ▪ Fully paid tuition programs at partner schools ▪ Internship opportunities ▪ Starter tool set bonus Educational Partnerships ▪ Technical school initiative to support employee career growth ▪ Offer skilled technicians path to meaningful upward career trajectory ▪ Skilled technicians are essential to providing ▪ Key differentiator in market aftermarket parts and service ▪ Approx. half of Alta employees are skilled technicians
This is a modal window.
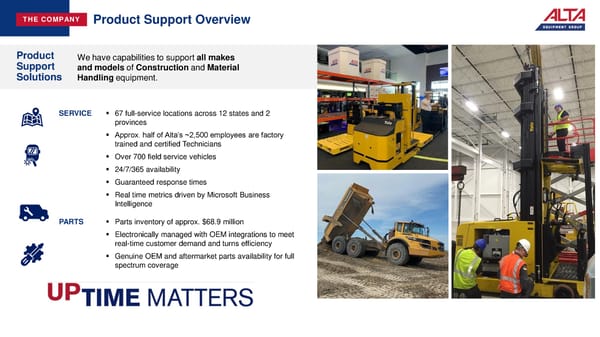
THE COMPANY Product Support Overview Product We have capabilities to support all makes Support and models of Constructionand Material Solutions Handlingequipment. SERVICE ▪ 67 full-service locations across 12 states and 2 provinces ▪ Approx. half of Alta’s ~2,500 employees are factory trained and certified Technicians ▪ Over 700 field service vehicles ▪ 24/7/365 availability ▪ Guaranteed response times ▪ Real time metrics driven by Microsoft Business Intelligence PARTS ▪ Parts inventory of approx. $68.9 million ▪ Electronically managed with OEM integrations to meet real-time customer demand and turns efficiency ▪ Genuine OEM and aftermarket parts availability for full spectrum coverage
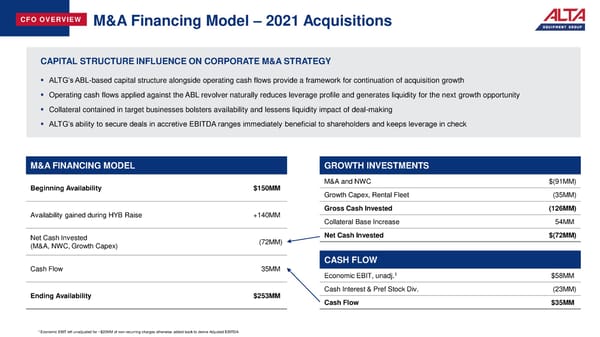
CFO OVERVIEW M&A Financing Model – 2021 Acquisitions CAPITAL STRUCTURE INFLUENCE ON CORPORATE M&A STRATEGY ▪ ALTG’s ABL-based capital structure alongside operating cash flows provide a framework for continuation of acquisition growth ▪ Operating cash flows applied against the ABL revolver naturally reduces leverage profile and generates liquidity for the next growth opportunity ▪ Collateral contained in target businesses bolsters availability and lessens liquidity impact of deal-making ▪ ALTG’s ability to secure deals in accretive EBITDA ranges immediately beneficial to shareholders and keeps leverage in check M&A FINANCING MODEL GROWTH INVESTMENTS Beginning Availability $150MM M&A and NWC $(91MM) Growth Capex, Rental Fleet (35MM) Availability gained during HYB Raise +140MM Gross Cash Invested (126MM) Collateral Base Increase 54MM Net Cash Invested (72MM) Net Cash Invested $(72MM) (M&A, NWC, Growth Capex) CASH FLOW Cash Flow 35MM Economic EBIT, unadj.1 $58MM Ending Availability $253MM Cash Interest & Pref Stock Div. (23MM) Cash Flow $35MM 1 Economic EBIT left unadjusted for ~$20MM of non-recurring charges otherwise added back to derive Adjusted EBITDA
APPENDICES Unaudited Reconciliation of Non-GAAP Financial Measures
