
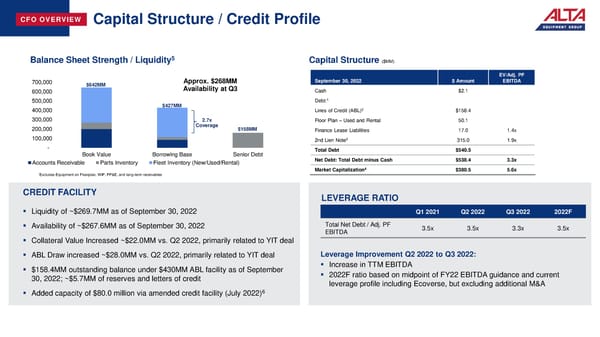
CFO OVERVIEW Capital Structure / Credit Profile Balance Sheet Strength / Liquidity5 Capital Structure ($MM) EV/Adj. PF 700,000 $642MM Approx. $268MM September 30, 2022 $ Amount EBITDA 600,000 Availability at Q3 Cash $2.1 1 500,000 $427MM Debt: 400,000 Lines of Credit (ABL)2 $158.4 300,000 2.7x Floor Plan – Used and Rental 50.1 200,000 Coverage $158MM Finance Lease Liabilities 17.0 1.4x 100,000 3 2nd Lien Note 315.0 1.9x - Total Debt $540.5 Book Value Borrowing Base Senior Debt Accounts Receivable Parts Inventory Fleet Inventory (New/Used/Rental) Net Debt: Total Debt minus Cash $538.4 3.3x 4 Market Capitalization $380.5 5.6x *Excludes Equipment on Floorplan, WIP, PP&E, and long-term receivables CREDIT FACILITY LEVERAGE RATIO ▪ Liquidity of ~$269.7MM as of September 30, 2022 Q1 2021 Q2 2022 Q3 2022 2022F ▪ Availability of ~$267.6MM as of September 30, 2022 Total Net Debt / Adj. PF 3.5x 3.5x 3.3x 3.5x EBITDA ▪ Collateral Value Increased ~$22.0MM vs. Q2 2022, primarily related to YIT deal ▪ ABL Draw increased ~$28.0MM vs. Q2 2022, primarily related to YIT deal Leverage Improvement Q2 2022 to Q3 2022: ▪ $158.4MM outstanding balance under $430MM ABL facility as of September ▪ Increase in TTM EBITDA 30, 2022; ~$5.7MM of reserves and letters of credit ▪ 2022F ratio based on midpoint of FY22 EBITDA guidance and current leverage profile including Ecoverse, but excluding additional M&A ▪ Added capacity of $80.0 million via amended credit facility (July 2022)6
 Earning Presentation Page 13 Page 15