
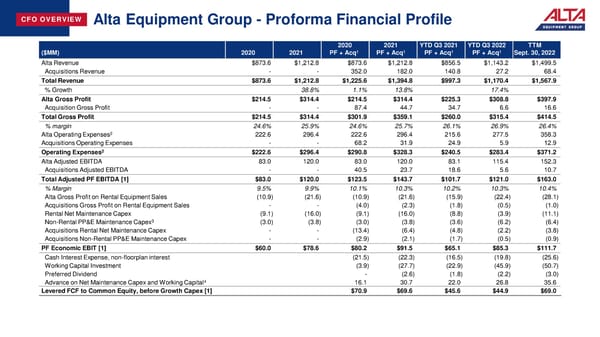
CFO OVERVIEW Alta Equipment Group - Proforma Financial Profile 2020 2021 YTD Q3 2021 YTD Q3 2022 TTM ($MM) 2020 2021 PF + Acq1 PF + Acq1 PF + Acq1 PF + Acq1 Sept. 30, 2022 Alta Revenue $873.6 $1,212.8 $873.6 $1,212.8 $856.5 $1,143.2 $1,499.5 Acquisitions Revenue - - 352.0 182.0 140.8 27.2 68.4 Total Revenue $873.6 $1,212.8 $1,225.6 $1,394.8 $997.3 $1,170.4 $1,567.9 % Growth 38.8% 1.1% 13.8% 17.4% Alta Gross Profit $214.5 $314.4 $214.5 $314.4 $225.3 $308.8 $397.9 Acquisition Gross Profit - - 87.4 44.7 34.7 6.6 16.6 Total Gross Profit $214.5 $314.4 $301.9 $359.1 $260.0 $315.4 $414.5 % margin 24.6% 25.9% 24.6% 25.7% 26.1% 26.9% 26.4% Alta Operating Expenses2 222.6 296.4 222.6 296.4 215.6 277.5 358.3 Acquisitions Operating Expenses - - 68.2 31.9 24.9 5.9 12.9 Operating Expenses2 $222.6 $296.4 $290.8 $328.3 $240.5 $283.4 $371.2 Alta Adjusted EBITDA 83.0 120.0 83.0 120.0 83.1 115.4 152.3 Acquisitions Adjusted EBITDA - - 40.5 23.7 18.6 5.6 10.7 Total Adjusted PF EBITDA [1] $83.0 $120.0 $123.5 $143.7 $101.7 $121.0 $163.0 % Margin 9.5% 9.9% 10.1% 10.3% 10.2% 10.3% 10.4% Alta Gross Profit on Rental Equipment Sales (10.9) (21.6) (10.9) (21.6) (15.9) (22.4) (28.1) Acquisitions Gross Profit on Rental Equipment Sales - - (4.0) (2.3) (1.8) (0.5) (1.0) Rental Net Maintenance Capex (9.1) (16.0) (9.1) (16.0) (8.8) (3.9) (11.1) 3 Non-Rental PP&E Maintenance Capex (3.0) (3.8) (3.0) (3.8) (3.6) (6.2) (6.4) Acquisitions Rental Net Maintenance Capex - - (13.4) (6.4) (4.8) (2.2) (3.8) Acquisitions Non-Rental PP&E Maintenance Capex - - (2.9) (2.1) (1.7) (0.5) (0.9) PF Economic EBIT [1] $60.0 $78.6 $80.2 $91.5 $65.1 $85.3 $111.7 Cash Interest Expense, non-floorplan interest (21.5) (22.3) (16.5) (19.8) (25.6) Working Capital Investment (3.9) (27.7) (22.9) (45.9) (50.7) Preferred Dividend - (2.6) (1.8) (2.2) (3.0) Advance on Net Maintenance Capex and Working Capital4 16.1 30.7 22.0 26.8 35.6 Levered FCF to Common Equity, before Growth Capex [1] $70.9 $69.6 $45.6 $44.9 $69.0
 Earning Presentation Page 12 Page 14