
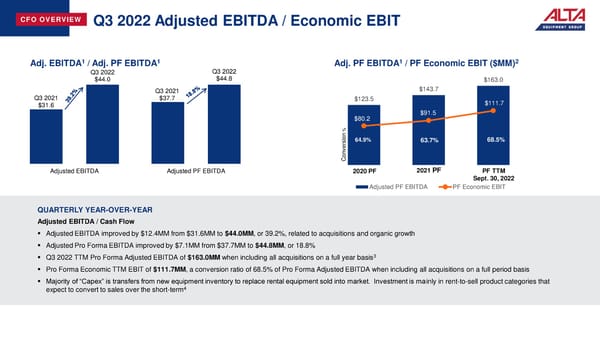
CFO OVERVIEW Q3 2022 Adjusted EBITDA / Economic EBIT 1 1 1 2 Adj. EBITDA / Adj. PF EBITDA Adj. PF EBITDA / PF Economic EBIT ($MM) Q3 2022 Q3 2022 $44.0 $44.8 $163.0 Q3 2021 $143.7 Q3 2021 $37.7 $123.5 $111.7 $31.6 $80.2 $91.5 % ion64.9% 63.7% 68.5% ers onv C Adjusted EBITDA Adjusted PF EBITDA 2020 PF 2021PF PF TTM Sept. 30, 2022 Adjusted PF EBITDA PF Economic EBIT QUARTERLY YEAR-OVER-YEAR Adjusted EBITDA / Cash Flow ▪ Adjusted EBITDA improved by $12.4MM from $31.6MM to $44.0MM, or 39.2%, related to acquisitions and organic growth ▪ Adjusted Pro Forma EBITDA improved by $7.1MM from $37.7MM to $44.8MM, or 18.8% ▪ Q3 2022 TTM Pro Forma Adjusted EBITDA of $163.0MM when including all acquisitions on a full year basis3 ▪ Pro Forma Economic TTM EBIT of $111.7MM, a conversion ratio of 68.5% of Pro Forma Adjusted EBITDA when including all acquisitions on a full period basis ▪ Majority of “Capex” is transfers from new equipment inventory to replace rental equipment sold into market. Investment is mainly in rent-to-sell product categories that expect to convert to sales over the short-term4
 Earning Presentation Page 11 Page 13