
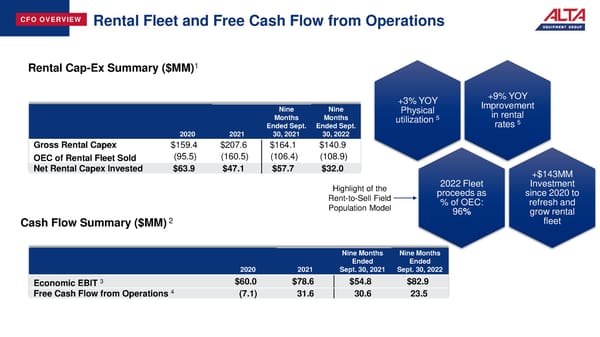
CFO OVERVIEW Rental Fleet and Free Cash Flow from Operations Rental Cap-Ex Summary ($MM)1 +3% YOY +9% YOY Nine Nine Physical Improvement Months Months 5 in rental utilization 5 Ended Sept. Ended Sept. rates 2020 2021 30, 2021 30, 2022 Gross Rental Capex $159.4 $207.6 $164.1 $140.9 OEC of Rental Fleet Sold (95.5) (160.5) (106.4) (108.9) Net Rental Capex Invested $63.9 $47.1 $57.7 $32.0 +$143MM Highlight of the 2022 Fleet Investment Rent-to-Sell Field proceeds as since 2020 to Population Model % of OEC: refresh and 96% grow rental Cash Flow Summary ($MM)2 fleet Nine Months Nine Months Ended Ended 2020 2021 Sept. 30, 2021 Sept. 30, 2022 3 $60.0 $78.6 $54.8 $82.9 Economic EBIT 4 Free Cash Flow from Operations (7.1) 31.6 30.6 23.5
 Earning Presentation Page 16 Page 18